← Back
GIS Mapping of Dengue Distribution
District-Level Spatial Analysis | Sri Lanka (2018–2020)
Project Overview
This project presents a district-level spatial analysis of dengue
incidence in Sri Lanka for the years 2018, 2019, and 2020.
Using Geographic Information Systems (GIS), thematic maps were
developed to visualize the spatial and temporal distribution of
dengue cases and to identify high-burden districts across the country.
Study Area
The study covers the entire island of Sri Lanka and analyses dengue
case distribution at the district administrative level.
This scale allows comparison between regions and supports
national-level public health planning and decision-making.
Data Sources
- District-level dengue case data (2018–2020)
- Administrative boundary shapefiles – Sri Lanka
- Base map layers for spatial reference
- Secondary data sources used for academic purposes
Methodology
- Data preprocessing and validation
- Joining dengue case data with district boundaries
- Thematic mapping using graduated colour symbology
- Year-wise spatial comparison (2018, 2019, 2020)
- Cartographic layout design for clear visual communication
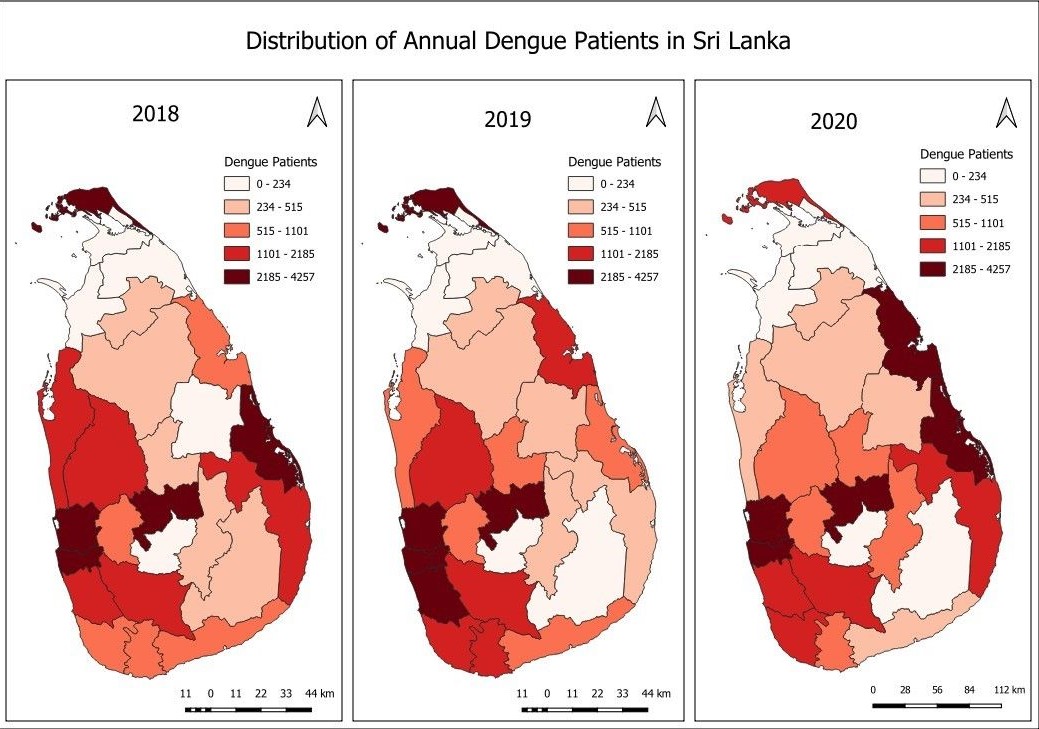
Dengue Distribution Maps (2018–2020)
The maps illustrate the spatial variation of dengue cases across
Sri Lankan districts over three consecutive years.
Darker colour shades represent higher dengue case counts,
highlighting persistent and emerging high-risk regions.
Map Interpretation
- High dengue incidence is observed in densely populated districts
- Temporal variation indicates year-to-year changes in outbreak intensity
- Urban and semi-urban districts show consistently higher case numbers
- The maps support visual identification of priority intervention areas
Tools & Skills
- QGIS
- Thematic mapping and spatial visualization
- Public health GIS applications
- Data classification and cartographic design
Conclusion
This project demonstrates how GIS can be effectively used to
visualize and analyze public health data.
The district-level dengue maps provide valuable spatial insights
that can support disease monitoring, awareness programmes,
and evidence-based public health planning in Sri Lanka.