Mean Expenditure Choropleth Map

The choropleth map visualises district-level variations in mean household expenditure, revealing distinct spatial patterns and expenditure concentration zones across Sri Lanka.
Spatial and Statistical Analysis using GIS
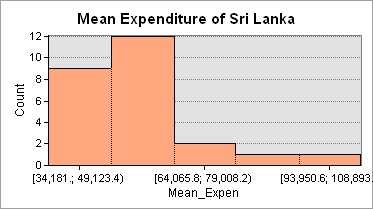
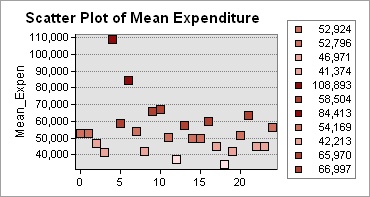
This project analyses the spatial variation of mean household expenditure across Sri Lanka using district-level census data. Geographic Information Systems (GIS) and exploratory statistical techniques were applied to identify regional expenditure patterns and socio-economic disparities.
The study area includes all administrative districts of Sri Lanka, allowing comparative analysis of expenditure characteristics across urban, semi-urban, and rural regions.
The choropleth map visualises district-level variations in mean household expenditure, revealing distinct spatial patterns and expenditure concentration zones across Sri Lanka.
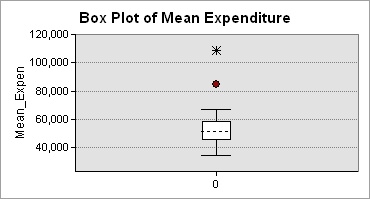
This project demonstrates the effective integration of GIS and statistical analysis to examine spatial expenditure patterns, providing insights that support regional planning and evidence-based socio-economic decision-making.