Mean Income Choropleth Map

The map illustrates spatial income disparities, with higher income concentrations observed in more urbanised districts.
Spatial and Statistical Analysis using GIS
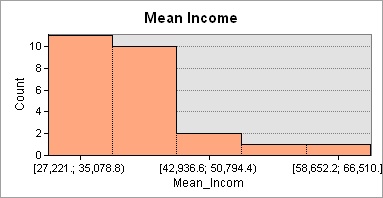
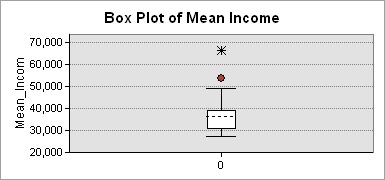
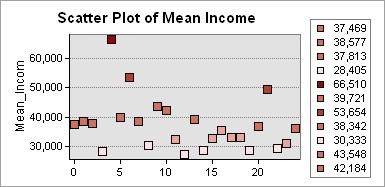
This project examines the spatial variation of mean household income across Sri Lanka using district-level census data. GIS-based thematic mapping and exploratory statistical techniques were applied to understand regional socio-economic disparities.
The analysis covers all administrative districts of Sri Lanka, enabling comparison between urban, semi-urban, and rural regions.
The map illustrates spatial income disparities, with higher income concentrations observed in more urbanised districts.
This project demonstrates the integration of GIS and statistical analysis to explore socio-economic patterns, supporting evidence-based planning and development decisions.