←
Population Distribution & Density of Tunis
Comparative Urban Demographic Mapping – 2024
Project Overview
This project presents a comparative spatial analysis of population
distribution and population density across municipalities in the
Tunis Metropolitan Area for the year 2024. The maps highlight
demographic concentration patterns and variations in urban intensity
to support urban planning and socioeconomic assessment.
Study Area
The study area covers the Tunis Metropolitan Area located in
northern Tunisia along the Mediterranean coast. The region
consists of densely populated urban cores, coastal municipalities,
and peripheral suburban zones with varying population characteristics.
Data Sources
- Municipal population statistics (2024) – National Institute of Statistics, Tunisia
- Municipal administrative boundaries – Tunisia administrative data
- Basemap data – Esri & OpenStreetMap contributors
Methodology
- Data preprocessing and municipal boundary verification
- Classification of population distribution using choropleth mapping
- Population density calculation (population per square kilometre)
- Comparative visualisation of absolute population vs density patterns
- Cartographic layout design with legend, scale bar, and north arrow
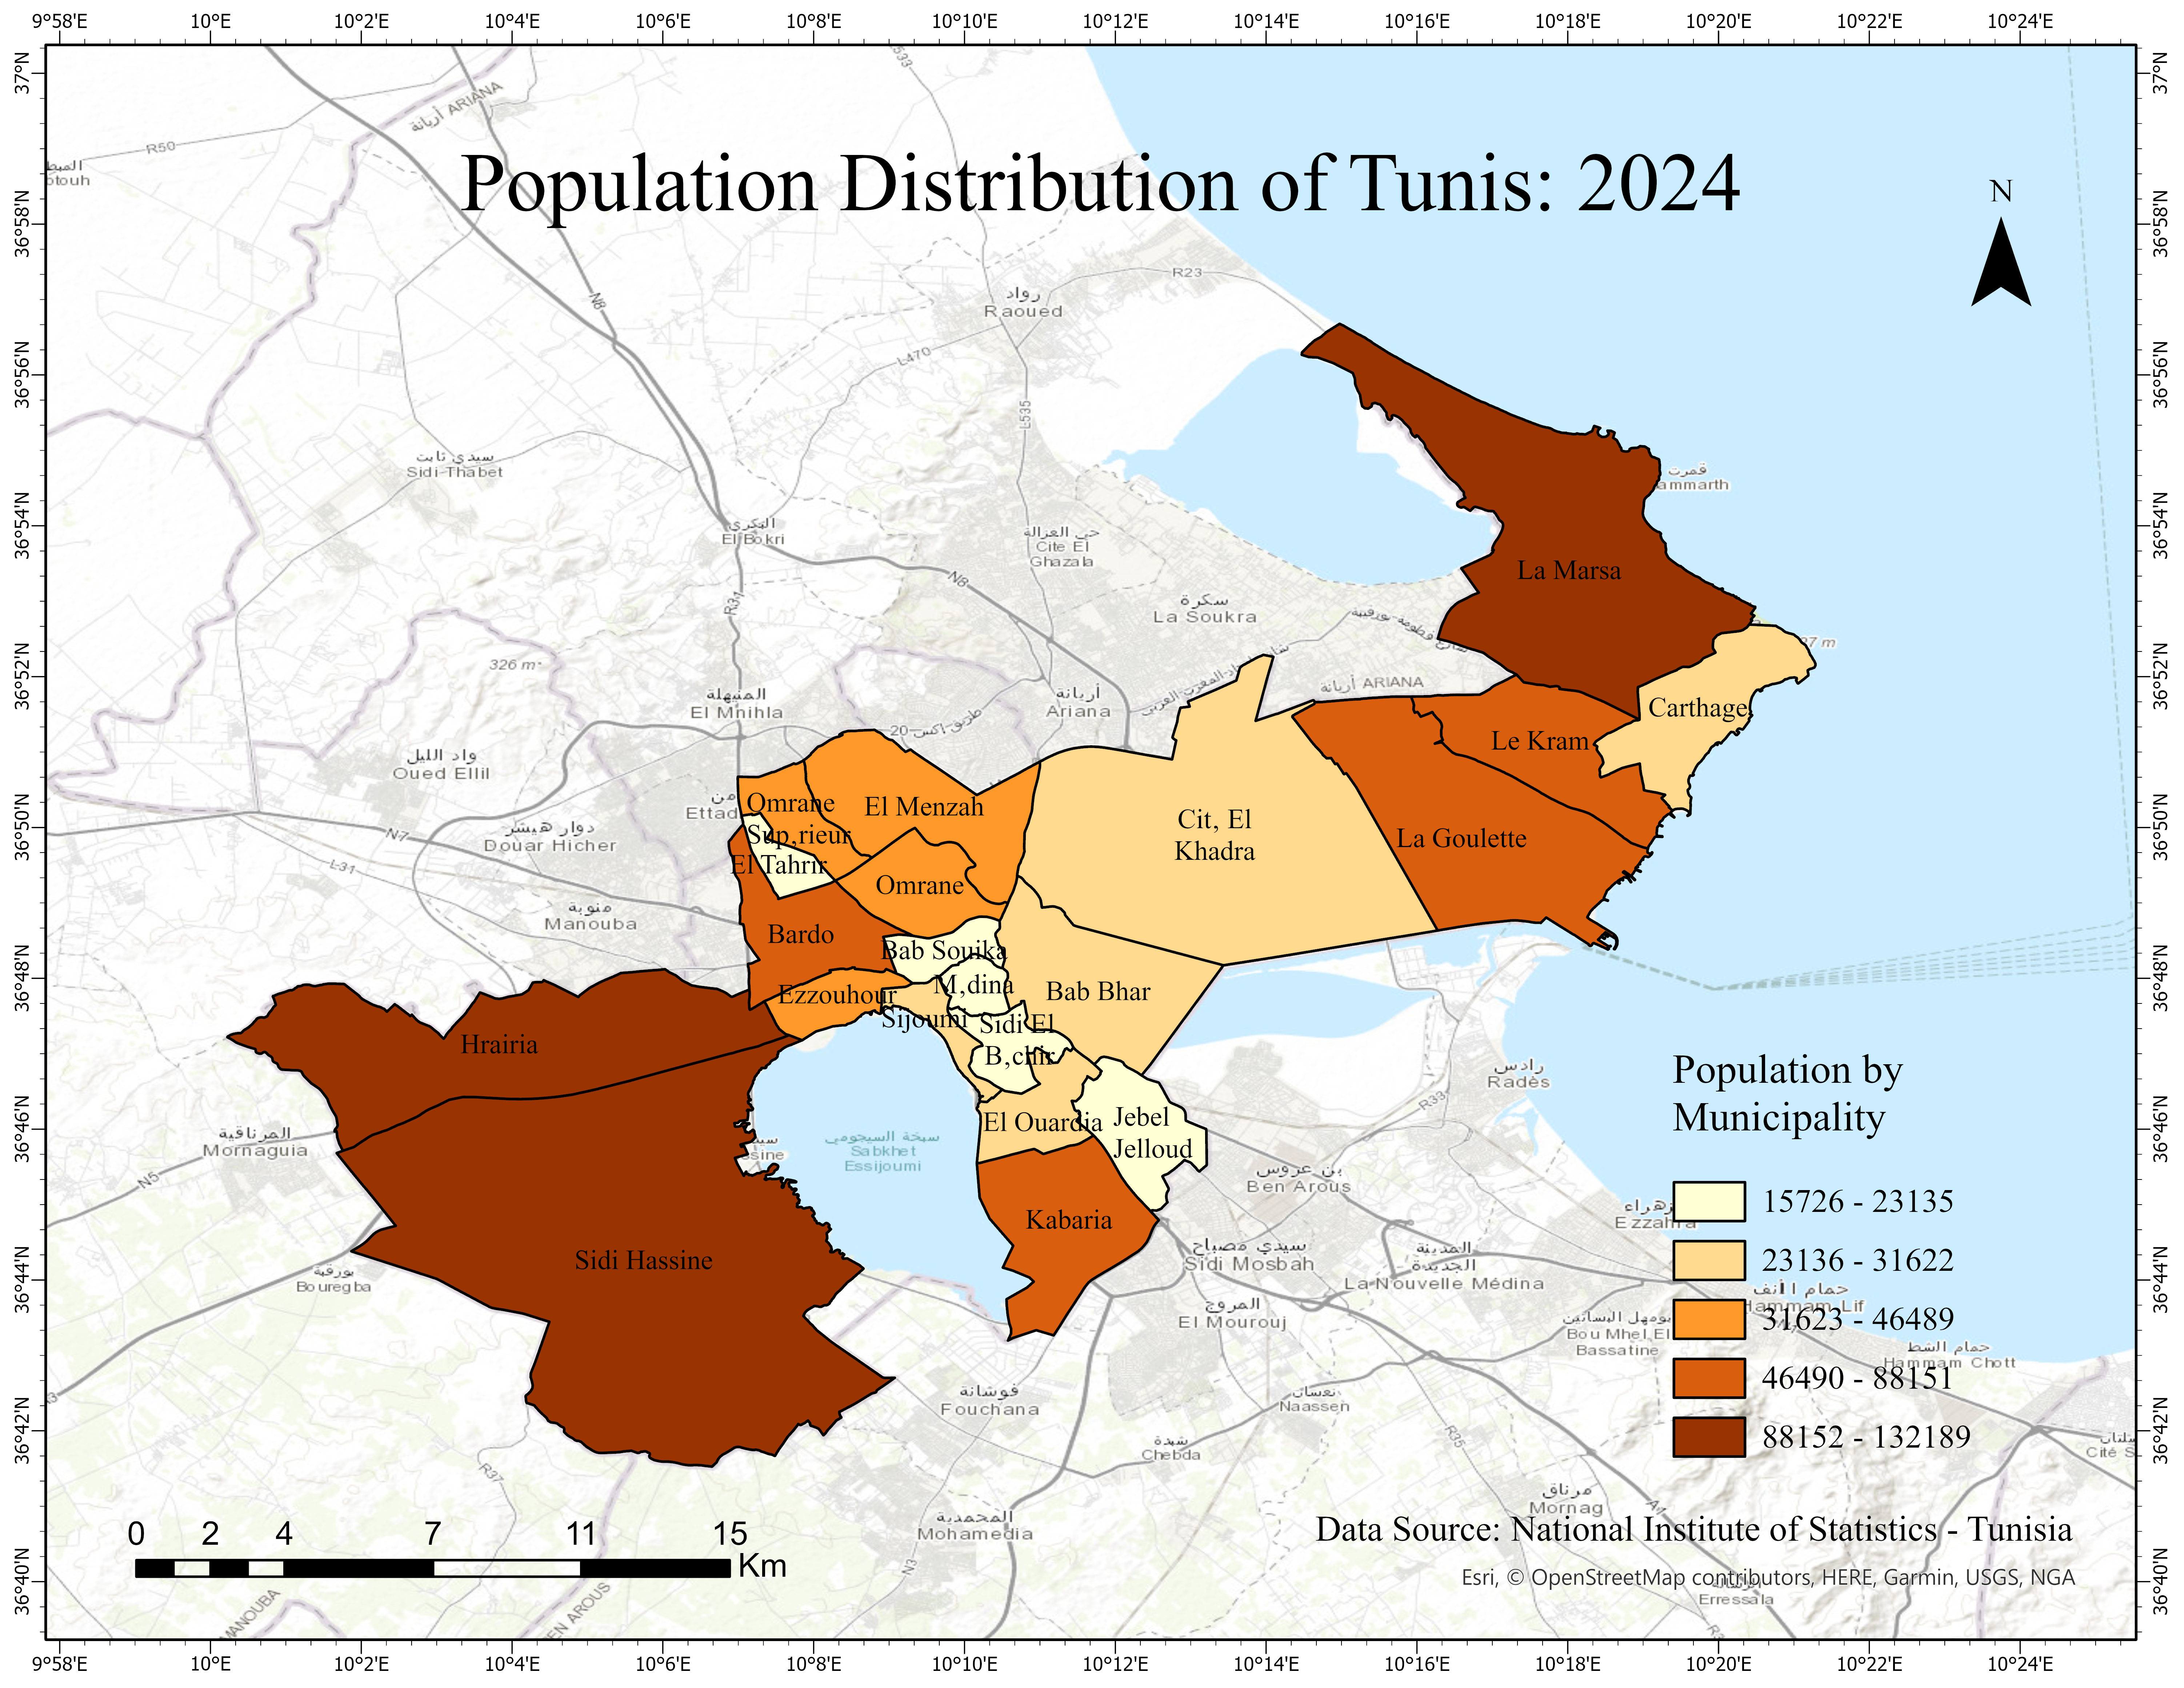
Population Maps of Tunis (2024)
The population distribution map illustrates the total population
within each municipality, while the population density map
highlights urban intensity by representing population per square
kilometre. Together, the maps reveal contrasts between large
municipalities with moderate density and smaller municipalities
with very high population concentration.
Population Classification
- Population Distribution (by municipality)
- Population Density (persons per sq km)
- Low to very high population concentration zones
- Urban core vs peripheral municipality comparison
Key Observations
- Central municipalities exhibit the highest population densities
- Peripheral municipalities show lower densities despite large land areas
- Coastal municipalities display moderate to high population concentration
- Population density patterns better reveal urban pressure than total population alone
Tools & Skills
- ArcGIS Pro
- Choropleth mapping and demographic analysis
- Population density calculation
- Cartographic design and map composition
Conclusion
This project demonstrates the importance of combining population
distribution and population density maps to better understand
urban demographic patterns. The comparative approach supports
evidence-based urban planning, infrastructure development, and
socioeconomic decision-making in metropolitan regions.